Weather & climate
−24 °C peak
Cold winter · 2045 · P90
8760-hour LOAD
P10–P90
JanJulDec
Scenario manager
4 / 12
Base 2032
v1
High growth v3.2 In forecast
+ Cold winter generated
+ Data centres generated
Demand & supply
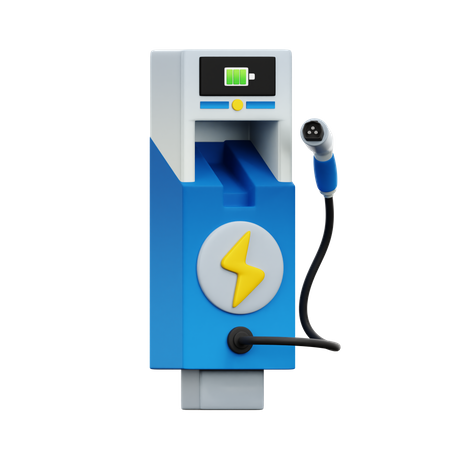
Load modifier · EV
MW
Residential Workplace
3.86 MW
00h12hpeak 21h
Generated · 1 200 EVs · L2 · P10–P90
Energy LMP
$84.20 /MWh
HE18 · day-ahead+12%
62%
Data center
Realization probability
Energized 2028 Q3

GridForesight Tech Platform

Introducing a Harmonized Grid Simulation Ecosystem

GridForesight Tech turns fragmented data sources into coherent demand and supply scenarios for explainable grid simulations.

Forecasted demand and supply, network constraints, and market outcomes SHOULD NOT be modeled from disconnected assumptions.

Layer 1

Harmonizing the source of truth before modeling

Simulations are only as good as the data behind them. GridForesight Tech starts with the data layer: GIS and electrical topology anchor the system, while time series, grid models, reports, and other documents are checked and organized into scenario-ready inputs.

  • GIS and electrical network topology
  • Historical measurements and weather records
  • Economic, population, land-use, and growth assumptions
  • Internal reports, third-party filings, and unstructured evidence
Learn more about the data layer
SCN-2045-HG · v3.28760 h
SCN-2045-BASE · v3.28760 h
SCN-2045-LG · v3.18760 h
SCN-2035-HG · v2.88760 h
SCN-2035-BASE · v2.88760 h
Grid data
outages · derates
Grid data
DER adoption
Grid data
large loads
Grid data
generation fleet
GIS & network
Measurements & weather
Hourly · 2015–2025
Growth assumptions
Economy
Population
Land use
Reports & evidence
Internal3rd-party
GridForesight TechScenario manager
Native load
EV charging
Heat pumps
Wind
Solar
Thermal
GridForesight TechDemand simulator
GridForesight TechSupply simulator
GridForesight TechCoherent simulator
Supply adequacy scenarios
SCN-2045-HG · v3.2
Adequacy metrics
LOLEEUEReserve margin
Locational adequacy
Regions / zones
Probabilistic outcomes
Risk metrics · P10 / P50 / P90

Layer 2

Generating coherent demand and supply scenarios

The demand and supply simulators run on the same weather, climate, economic, growth, and network assumptions. Every scenario carries a unique identifier, so any profile can be traced back to the inputs, assumptions, and model version behind it. That makes every result interpretable and reproducible.

  • 8760-hour probabilistic demand and supply scenarios
  • Shared weather and climate assumptions across demand and supply
  • Versioned model configurations with full scenario lineage
  • Traceable inputs and reproducible model runs
  • Layer 3

    Running simulations
     built on coherent scenarios

    Once demand and supply scenarios are traceable and internally consistent, they can be reused across studies with confidence. GridForesight Tech currently runs three applications on that foundation: market simulation, distribution system simulation, and data center load simulation.

    SIMULATOR 1

    Market Simulator

    The market simulator uses coherent demand and supply scenarios with the transmission network model to study future market conditions under different weather, growth, supply, and policy assumptions.

    • Energy-market and reserve-market studies
    • Day-ahead and real-time market assumptions
    • Energy LMPs, reserve prices, congestion, shortfalls, and oversupply
    Learn more about the market simulator
    Hourly dispatch · one day out of the 8,760-h simulated year
    2035 base scenario
    26 GW130 $160$80$0 00:0012:0023:00
    365 days · daily peak LMPSelected day
    8,760 h
    JanAprJulOctDec
    Substation 40 · Jul 17 · hour of 8,760
    Load
    Energy LMP
    Gas dispatched
    Wind + solar
    Nuclear + hydro Wind Solar Gas Demand LMP
    Feeder 12-F3 · net flow · peak day of the 8,760-h simulated year
    14 MW0−8 00:0012:0023:00 Transformer rating 12 MW Reverse-flow limit −4 MW
    365 days · daily peak transformer loadingSelected day
    8,760 h
    JanAprJulOctDec
    Selected hour · Aug 2 · hour of 8,760
    Net flow
    Transformer loading
    Well-being state
    Selected scenario Other scenario Reverse power flow (DER export) Transformer rating

    SIMULATOR 2

    Distribution System Simulator

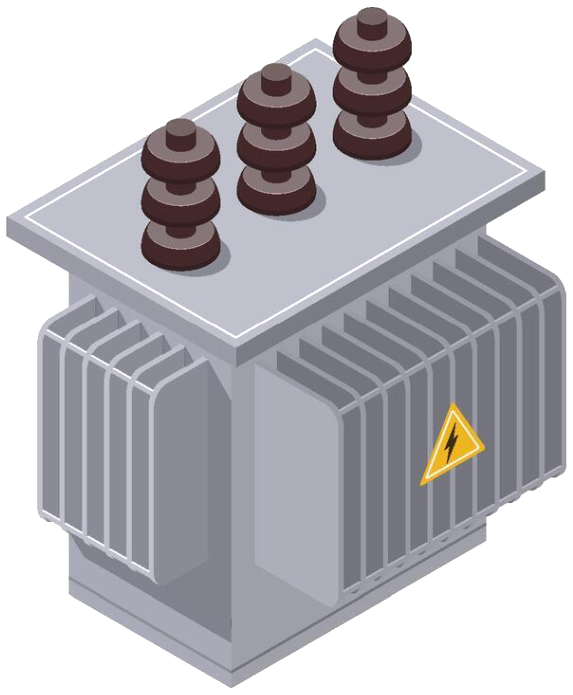
    The distribution system simulator uses feeder, transformer, and substation models together with demand and behind-the-fence supply scenarios to evaluate asset stress across plausible futures and provide insights on the relevant risks the system will face.

    • Risk-based well-being analysis
    • Feeder, transformer, and substation loading
    • Reverse power flow and DER-driven operating risk
    • Investment timing under scenario uncertainty
    Learn more about distribution simulation

    SIMULATOR 3

    Data center simulator

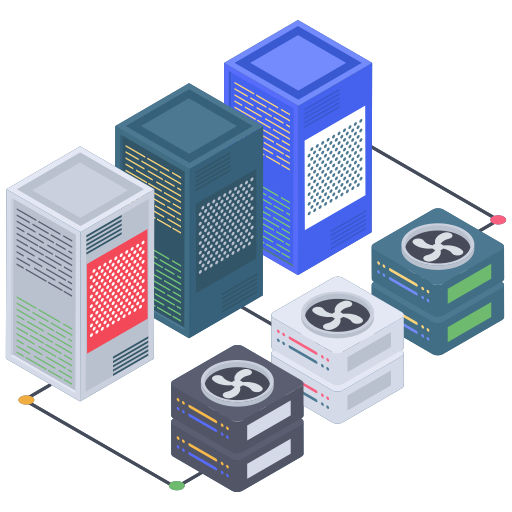
    Data center load can be treated as a dedicated application and as a load modifier inside the demand simulator. The simulator captures realization probability, energization timing, ramp-up, operating shape, and short-term second-scale behavior.

    • Probability-weighted pipeline of announced projects
    • Energization timing and ramp-up to nameplate
    • AI training, inference, and cloud operating shapes
    • Second-scale load swings from AI training steps
    Learn more about the data center simulator
    Data center pipeline · 2026–2035 · probability-weighted annual peak
    6 GW30 202620302035
    Announced
    Expected load
    Workload mix
    Operating shape · 1 s Each project carries an 8,760-hour operating shape; AI training steps swing 60→100% of site load within seconds.
    AI training · committed AI training · likely AI training · speculative Inference + cloud (same tiers) Expected load P10–P90

    Platform extensibility

    Extending the Platform on the Same Scenario Foundation

    The data layer, the scenario layer, and the application layer are kept separate, so new applications can be added without rebuilding the assumptions underneath them.

    GridForesight Tech

    Building a shared view of the future grid

    GridForesight Tech brings demand, supply, network, and market planning onto a single foundation, so decisions across your organization rest on the same evidence.